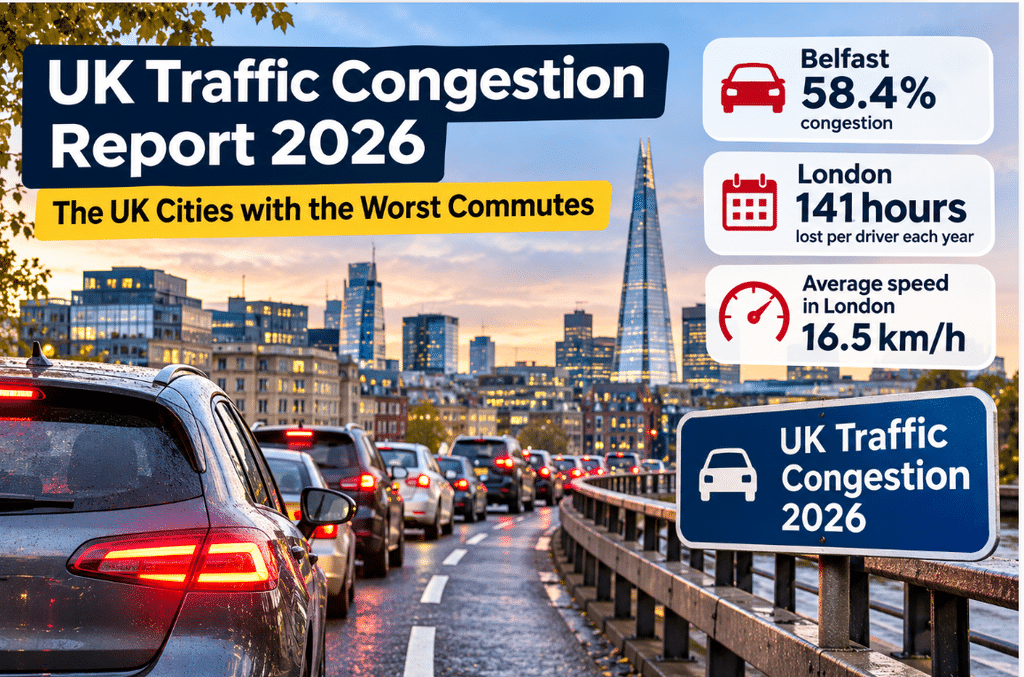
Which UK city has the worst traffic? According to the TomTom Traffic Index 2025 figures, Belfast recorded the highest congestion level among the UK cities listed, while London had the slowest average driving speed and the greatest annual rush-hour time loss in the supplied comparison.
Traffic congestion affects more than just the daily commute. Delays can disrupt school runs, business journeys, deliveries and trips to the airport. Understanding where congestion is worst, when roads are busiest and how journey times are measured can help drivers plan more effectively.
Our guide compares the most and least congested UK cities using the 2025 TomTom figures, including average driving speeds, changes in congestion and estimated hours lost during rush hour.
UK traffic congestion in 2025: key findings
- Most congested city: Belfast, with a congestion level of 58.4%.
- Second most congested: Edinburgh, at 57.9%.
- Slowest average driving speed: London, at 16.5 km/h (approximately 10.3 mph).
- Most annual rush-hour time lost: London, at 141 hours.
- Major congestion increase: Ipswich, up 4.1 percentage points year on year.
- Least congested city in the supplied ranking: Middlesbrough, at 31.2%.
These figures demonstrate why traffic congestion should not be measured using a single statistic. A city can have a high percentage congestion level without having the slowest average speeds or the greatest annual time loss.
The most congested UK cities in 2025
Belfast tops the supplied TomTom UK congestion ranking at 58.4%, followed closely by Edinburgh at 57.9%. Cambridge, Exeter and Brighton & Hove also feature among the cities experiencing the greatest relative delays.
| City | Congestion level |
|---|---|
| Belfast | 58.4% |
| Edinburgh | 57.9% |
| Cambridge | 54.1% |
| Exeter | 53.7% |
| Brighton & Hove | 52.5% |
| Norwich | 52.4% |
| Hull | 52.0% |
| London | 51.6% |
What does this mean? A congestion level of 58.4% means that a journey takes approximately 58.4% longer than it would under free-flow traffic conditions. It does not mean that 58.4% of the city’s roads are congested.
Which UK city has the slowest traffic?
London has the slowest average driving speed in the supplied 2025 comparison, at just 16.5 km/h, or approximately 10.3 mph.
Edinburgh and Manchester also have particularly low average driving speeds, reflecting the difficulties motorists can face navigating busy urban roads.
| City | Average speed | Approx. mph |
|---|---|---|
| London | 16.5 km/h | 10.3 mph |
| Edinburgh | 18.7 km/h | 11.6 mph |
| Manchester | 20.8 km/h | 12.9 mph |
| Leicester | 21.2 km/h | 13.2 mph |
| Liverpool | 21.8 km/h | 13.5 mph |
| Bristol | 22.5 km/h | 14.0 mph |
| Cambridge | 22.6 km/h | 14.0 mph |
Average driving speed is influenced by road layouts, junctions, traffic lights, speed limits and traffic volumes. It should not be interpreted as a direct measurement of congestion alone.
How many hours do UK drivers lose in traffic each year?
TomTom’s annual rush-hour time-loss measure estimates how much additional time drivers spend travelling during peak periods compared with free-flow conditions, using a standard commuting assumption.
In the supplied 2025 figures, London has the highest estimated annual time loss at 141 hours, followed by Edinburgh at 127 hours and Manchester at 126 hours.
| City | Annual hours lost | Equivalent 8-hour working days |
|---|---|---|
| London | 141 | 17.6 |
| Edinburgh | 127 | 15.9 |
| Manchester | 126 | 15.8 |
| Cambridge | 122 | 15.3 |
| Bristol | 118 | 14.8 |
| Leicester | 118 | 14.8 |
| Liverpool | 99 | 12.4 |
| Sheffield | 99 | 12.4 |
| Nottingham | 98 | 12.3 |
| Cardiff | 81 | 10.1 |
The working-day equivalents illustrate the scale of the delays. They do not mean that every driver in these cities personally loses this amount of time, as actual commuting patterns vary.
Why is London traffic so slow?
London combines a large population, high travel demand, complex junctions, public transport infrastructure, deliveries, pedestrians and competing uses of road space.
These factors can contribute to low average speeds even when London’s percentage congestion level is lower than that of cities such as Belfast or Edinburgh.
According to the supplied figures, London drivers experienced an average speed of 16.5 km/h and an estimated 141 hours of annual rush-hour time loss in 2025.
Drivers should also distinguish traffic congestion from London’s Ultra Low Emission Zone and Congestion Charge. These are separate charging schemes with different rules.
Which UK cities experienced the biggest increases in congestion?
The supplied TomTom figures indicate that several UK cities experienced noticeable increases in congestion levels between 2024 and 2025.
| City | Year-on-year change |
|---|---|
| Ipswich | +4.1 percentage points |
| Swansea | +3.7 percentage points |
| Norwich | +3.1 percentage points |
| Bristol | +3.0 percentage points |
| Glasgow | +3.0 percentage points |
| Birmingham | +2.4 percentage points |
| Brighton & Hove | +2.3 percentage points |
These changes are expressed in percentage points, not percentage increases. For example, a rise from 40% congestion to 43% congestion represents an increase of three percentage points.
Not every city experienced worsening congestion. The supplied figures show slight reductions for Nottingham and Bournemouth.
Which UK cities have the least traffic congestion?
Middlesbrough recorded the lowest congestion level among the cities identified in the supplied 2025 comparison, at 31.2%.
| City | Congestion level |
|---|---|
| Middlesbrough | 31.2% |
| Coventry | 34.3% |
| Leeds | 34.4% |
| Stoke-on-Trent | 35.8% |
| Inverness | 37.0% |
Lower congestion levels do not necessarily mean that every journey is quick or free from delays. Roadworks, incidents and local traffic conditions can still affect individual routes.
UK traffic congestion comparison: major cities
The following table brings together the key metrics for ten UK cities from the supplied TomTom Traffic Index 2025 figures.
| City | Congestion | Annual change | Average speed | Hours lost |
|---|---|---|---|---|
| London | 51.6% | +1.0 pp | 16.5 km/h | 141 |
| Manchester | 48.1% | +1.6 pp | 20.8 km/h | 126 |
| Liverpool | 45.8% | +2.0 pp | 21.8 km/h | 99 |
| Bristol | 51.3% | +3.0 pp | 22.5 km/h | 118 |
| Edinburgh | 57.9% | +0.7 pp | 18.7 km/h | 127 |
| Sheffield | 46.5% | +1.2 pp | 25.1 km/h | 99 |
| Leicester | 49.6% | +0.9 pp | 21.2 km/h | 118 |
| Nottingham | 43.1% | -0.3 pp | 22.9 km/h | 98 |
| Cardiff | 44.8% | +1.3 pp | 25.9 km/h | 81 |
| Bournemouth | 39.1% | -0.2 pp | 30.7 km/h | 65 |
Source: TomTom Traffic Index 2025 figures supplied for this article. Annual changes are shown in percentage points (pp).
What causes traffic congestion in UK cities?
Traffic congestion develops when demand for road space approaches or exceeds the capacity of the road network. Several factors can contribute to delays:
- High traffic demand: Large numbers of vehicles using the same roads during commuting and school travel periods.
- Roadworks: Temporary lane closures and diversions reducing available capacity.
- Junction bottlenecks: Traffic lights, roundabouts and busy intersections slowing vehicle movements.
- Incidents: Collisions, breakdowns and emergency road closures causing unexpected delays.
- Freight and deliveries: Commercial traffic competing for limited urban road space.
- Weather: Heavy rain, snow and poor visibility affecting speeds and journey reliability.
- Public transport disruption: Some travellers may switch to cars when alternative services are unavailable.
The importance of each factor varies between cities. The congestion figures alone cannot establish which factor caused a particular city’s increase in delays.
How can drivers avoid rush-hour traffic?
Although congestion cannot always be avoided, motorists can take practical steps to reduce the risk of delays.
- Check live traffic conditions: Review incidents, roadworks and journey times before departure.
- Travel outside peak periods: Where possible, avoid the busiest commuting and school-run times.
- Compare alternative routes: Consider whether a slightly longer route offers more reliable journey times.
- Allow extra time: Build a realistic buffer into time-sensitive journeys.
- Check planned roadworks: Motorway and local authority roadworks can affect journeys well beyond the immediate closure.
- Consider alternative transport: Rail, bus, cycling or walking may be practical for some journeys.
Live traffic information is especially important because annual congestion rankings describe typical conditions rather than predicting the exact delay on a particular journey.
How much extra time should you allow when driving to the airport?
Airport journeys are particularly sensitive to traffic delays because travellers must allow time for parking, airport transfers, check-in and security.
If you are driving to Gatwick, Heathrow, Manchester, Birmingham, Bristol or another UK airport, check your route before leaving and allow additional time for incidents or roadworks.
Motorway and major road conditions may differ significantly from the average congestion figures measured within a city.
If you have booked airport parking, check the car park’s arrival instructions and allow time for any shuttle transfer or walk to the terminal.
APH provides airport parking and hotel options across the UK, helping travellers plan the parking stage of their journey before departure.
How does TomTom measure traffic congestion?
The TomTom Traffic Index analyses vehicle movement and journey-time data to compare traffic conditions across cities.
Different measurements describe different aspects of congestion:
- Congestion level: The percentage increase in journey time compared with free-flow traffic conditions.
- Average speed: The typical vehicle speed recorded across the measured road network.
- Time lost during rush hour: An estimate of additional annual travel time under TomTom’s standard commuting assumptions.
- Year-on-year change: How the congestion level has changed compared with the previous year, expressed in percentage points.
These metrics should be compared separately. A city with slower average speeds is not necessarily the city with the highest congestion percentage.
For the original data and methodology, visit the TomTom Traffic Index.
Frequently asked questions about UK traffic congestion
Which UK city had the worst traffic congestion in 2025?
Belfast recorded the highest congestion level in the supplied TomTom 2025 UK ranking, at 58.4%, followed by Edinburgh at 57.9%.
Is London the most congested city in the UK?
Not by congestion percentage in the supplied 2025 figures. Belfast and Edinburgh ranked higher. However, London had the slowest average driving speed and the highest estimated annual rush-hour time loss among the cities compared.
What is the average traffic speed in London?
The supplied TomTom 2025 data puts London’s average driving speed at 16.5 km/h, equivalent to approximately 10.3 mph.
How many hours do London commuters lose in traffic?
TomTom’s supplied 2025 figures estimate 141 hours of annual rush-hour time loss in London under its standard commuting assumptions. Individual drivers may experience substantially different delays.
Which UK city has the least traffic congestion?
Middlesbrough recorded the lowest congestion level among the cities identified in the supplied comparison, at 31.2%, followed by Coventry at 34.3% and Leeds at 34.4%.
Which UK cities saw congestion increase the most?
The supplied 2025 figures identify Ipswich (+4.1 percentage points), Swansea (+3.7), Norwich (+3.1), Bristol (+3.0) and Glasgow (+3.0) among the cities with notable increases.
Does a 50% congestion level mean half the roads are blocked?
No. A 50% congestion level means that journeys take approximately 50% longer than under free-flow traffic conditions. It does not describe the proportion of roads experiencing traffic jams.
What is the difference between congestion and average speed?
Congestion measures additional journey time relative to free-flow conditions, while average speed measures how quickly vehicles travel. A city can have low average speeds because of its road layout and speed limits without necessarily having the highest relative congestion.
When is UK rush-hour traffic usually worst?
Traffic is often busiest during weekday morning and evening commuting periods, although the precise peak times vary by city, route, school schedules and local conditions. Live traffic information provides a better indication for individual journeys.
How can I avoid traffic when travelling to the airport?
Check live traffic conditions, allow time for unexpected delays and plan your airport parking and terminal transfer in advance. Avoid relying solely on average city congestion statistics when estimating a specific motorway journey.
UK traffic congestion: the key takeaway
The 2025 TomTom figures show that serious traffic delays are not limited to London. Belfast and Edinburgh recorded particularly high congestion levels, while London stood out for slow average driving speeds and the greatest estimated annual rush-hour time loss in the supplied comparison.
For drivers, the practical lesson is to plan around real journey conditions rather than relying on distance alone. Checking live traffic, allowing extra time and preparing for alternative routes can make commuting and longer journeys more predictable.
Source: TomTom Traffic Index – UK rankings. Figures are from the supplied 2025 dataset and should be checked against the official source before publication.
Content reviewed: 9 November 2026. The rankings and figures refer to 2025 traffic conditions, not 2026 measurements.